

How did REsurety and REmap get started?
In business school I did research on managing the weather risk in renewables, with the view that when and how much the wind blows and the sun shines was becoming the driving force of power market risk management, versus the cost of natural gas and the cost of coal. But most of the tools needed to understand and manage that new risk were missing.
REmap is a new chapter for us. We discovered that a lot of the data and analytics we had built up, to support an insurer holding the weather risk of renewable energy projects, was useful to a broader audience – for a C&I buyer to evaluate RFP bids, for a developer to decide where to focus greenfield development, for an investment bank to advise on the buy side or sell side of an M&A opportunity.
Hourly weather patterns at a given renewable energy project are not easily observable: you can't simply look them up on Bloomberg or SNL - and that creates opacity in the market. People weren't able to see, feel and touch the value of a project, how it performed during the last heat wave or the polar vortex in 2014, how it responded to low demand, high demand, or natural gas prices.
We viewed that as an opportunity to provide an information tool that complemented our risk products, to really provide a step change in the transparency and insight available to the renewables market, and drive better decision-making.
How is the information in the dataset gathered in the first place?
With a lot of work. From the acronym soup of independent system operators, like ERCOT in Texas. NASA puts out weather data. The Energy Information Administration puts out information on how projects perform on a monthly basis. The Federal Energy Regulatory Commission has electronic quarterly reports. The FAA knows where the wind towers are, and so forth.
The first step was to assimilate all that information and have it talk to each other. A lot also came down to data quality, since manual reporting is not flawless.
And then, complementing that with proprietary modeling. For example, you might know that a given plant produced 100 megawatt-hours in June 2017. That's not terribly helpful in knowing how valuable those 100 megawatt-hours are, because the power price changes every single hour, so in which hours those 100 megawatt-hours were actually generated can determine whether June was a great month or a not-so-great month for that project.
We use the knowledge of what turbine technology is there, or what solar panel technology, and all the things that roll up to how a given hour of weather translates into fuel and power, to attribute those 100 megawatt-hours to the individual hours they are likely to have been produced. With that work done you can generate metrics around congestion, value, hedgeability, etc. It's really that combination of assimilating public data, and then complimenting it with proprietary modeling, that lies behind REmap.
What stories has the tool gathered by pulling power prices from wind and solar so far?
We start with a map of the United States showing every climate zone, where the weather resource results in a consistent value of power, and every dot is a hypothetical wind or solar project. Or if we want to look at operating projects, then every dot on the screen now is where an actual physical project already exists.
The data and the tool is updated every month, which brings new information: How is California responding to more solar? What's the role of solar penetration in Texas? How fast is the recovery hitting one market versus another as we come out of the coronavirus economic shutdown?
One story that has come out of this is the combined impact in the lower Midwest of low natural gas prices after a warm winter, lowered global demand from coronavirus, and relatively high generation of wind. The price of $12 a megawatt-hour was already pretty low early in the year, but going into April we saw the average value of power in parts of western Oklahoma, for example, dropping below $2 a megawatt-hour. Which is unprecedented. In PJM, the Northern Illinois region similarly dropped to an all-time low in April.
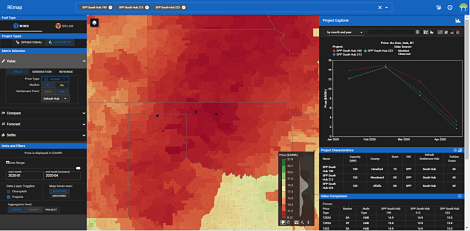
This image from REsurety’s new REmap tool shows how the COVID-19 shutdown, low natural gas prices, and high winds drove the wholesale value of electricity (weighted for time of production) to all-time lows in parts of the Lower Midwest – even dropping below $2 per MWh in some locations in April. Portions of North Texas, Oklahoma, and Kansas are shown.
Are any investment or deployment decisions being made on the basis of this information?
Our first customers really span the spectrum of use cases: a hedge provider, an investment bank, a developer, and a C&I buyer. REmap is valuable to anybody buying or selling renewable energy assets or looking to buy or sell long-term contracts from renewable projects.
As an example, if you're a buyer of power and you're running an RFP saying, "I want to buy clean energy in Texas," and you get 40 bids, you want to be able to compare those on an apples-to-apples basis. Whether it’s in West Texas, Eastern or Southern Texas, they all produce clean energy, but at very different prices and very different values to you. Depending on the location, a $20 PPA may be much more attractive than a $12 PPA – but that’s not going to be obvious unless you’re armed with really good information.
Given the factors this tool has picked up, which areas of the country are currently enjoying low power prices because of those factors?
At the moment, almost every part of the country is enjoying low power prices. And if you're enjoying them, you're likely a consumer and not a generator of power.
It doesn't really matter if you're a wind farm or a solar project or a gas plant: across the board, power prices are low, but they are particularly low in certain areas. That $2 per megawatt-hour Oklahoma example is an extreme. But you have all-time lows or close to all-time lows occurring in multiple parts of the country, in large part because the natural gas price is so low, combined with low demand from the economic impacts of coronavirus.
Those two factors are impacting the entire energy system, but they can be offset or exaggerated in the renewables world depending on how well the timing of your generation is matching up with hour-by-hour lows or highs of power price. Wind is less valuable than baseload in most places, except for maybe along the Texas coastline. Solar operates at a steep discount in California, but operates at a large premium in places like Texas where daytime power prices are higher than in the evening.
This is why increasingly we’re seeing developers looking to build wind projects in areas where it's not necessarily that windy, and solar projects in areas where it's not that sunny, because from a revenue perspective, that's the optimum, because the value is so low in areas where there is already very high penetration of a given technology type.
Who can use this tool currently, or to whom are you providing the information that it generates?
At the moment, it's available to any paying customer or anybody who wants a trial.
As the use of these kinds of tools and information grows, what are the long-term implications for the clean energy industry?
Since we started the company in 2012, there has been a dramatic evolution of the industry. In the early days of the renewables business, you built wind projects where it was windy, and where a larger utility motivated by policy was going to buy your power for 20 years at your interconnection point. And similarly for solar, just going where it was sunny.
Since then, the math has become a lot more complicated as a result of the maturity and success of the renewables market.
Renewables today stand on their own two feet financially. I'm sure we can get into a spirited debate around the role of policymaking for pricing, negative externalities of coal plants and gas plants, and the Production Tax Credit and its role in wind, but by-and-large, renewables are winning today because of economics.
That's a great thing, but it also means that a lot of the complexity and risk that was being historically socialised to ratepayers through utility procurement of renewables, at least in the US, has shifted to private actors.
You have sustainability-motivated commercial and industrial buyers like Microsoft, who are procuring power from enormous volumes of renewables. But now they're taking the risk of, “Does the wind blow during the hour that my data center is running? And if the power markets change, and I have a lot of demand at night, my solar projects are not very likely to support that, absent significant investment in batteries.”
The scale and complexity of risks that have to be managed in terms of congestion has changed dramatically. That requires a step change in the information that decision makers need to understand and manage those risks.
Our goal for this tool is to drive better decision-making through better information. That's where we see REmap fitting into the continued success of the renewables market.